4QFY2019 Result Update | Banking
May 25, 2019
ICICI Bank
BUY
CMP
`431
Performance Highlights
Target Price
`490
Particulars (` cr)
Q4FY19
Q3FY19
% chg (qoq) 4QFY18
% chg (yoy)
Investment Period
12 Months
NII
7,620
6,875
10.8
6,022
27
Pre-prov. profit
6,233
6,146
1.4
7,513
(17)
Stock Info
PAT
969
1,605
(39.6)
1,019
(5)
Sector
Banking
Source: Company, Angel Research
Market Cap (` cr)
2,64,789
For Q4FY2019, ICICI Bank reported net profit of `969cr, which came in lower
Beta
1.3
than estimates owing to higher provisions of `5,451cr. Higher provisions were due
52 Week High / Low
433/256
to aging of bad assets and increased slippages, which led to PCR increasing by
Avg. Daily Volume
11,24,581
217bps qoq to 70.62% (considering Technical/prudential write-offs, it stood at
Face Value (`)
2
76%).
BSE Sensex
39,434
Nifty
11,844
Healthy growth in retail advances; credit costs up on higher PCR: During
Reuters Code
ICBK.NS
Q4FY2019, the bank’s advances grew by 14.5% yoy (4% qoq) aided by healthy
Bloomberg Code
ICICIBC@IN
retail loan book growth of 21.2% yoy. The main drivers leading to the growth in
the retail loan book were personal loans/business banking, which grew by
48.6%/39.3% yoy respectively. Retail contribution to total loans increased to 60.1%
Shareholding Pattern (%)
vs. 57 in Q4FY2018.
Promoters
NA
Deposits growth was healthy at 16.4% yoy; CASA deposits also saw a growth of
MF / Banks / Indian Fls
31.7
11.7% yoy. Reported NIM for the quarter expanded 25bps/23bps qoq/yoy to
FII / NRIs / OCBs
60.4
3.47% owing to interest collection on NPAs and increase in advance yield.
Indian Public / Others
7.7
On the asset quality front, the bank witnessed slippages (fresh formation of NPA)
to the tune of `3,547cr during the quarter, which is higher than recent trend.
Majority of the slippages are from the portfolio rated BB & below and technical
Abs. (%)
3m 1yr
3yr
downgrade of sugar account. Further, GNPA/NNPA ratio declined by
Sensex
8.2
13.0
53.4
105bps/52bps qoq to 6.7%/2.06% respectively, due to higher provisioning.
ICICI Bank
16.7
40.8
101.3
Outlook & Valuation: At the current market price, the bank’s core banking
business (after adjusting the value of subsidiaries) is trading at 1.6x FY2021E ABV.
We believe strength of liability franchise (CASA - 50%), shift in loan mix towards
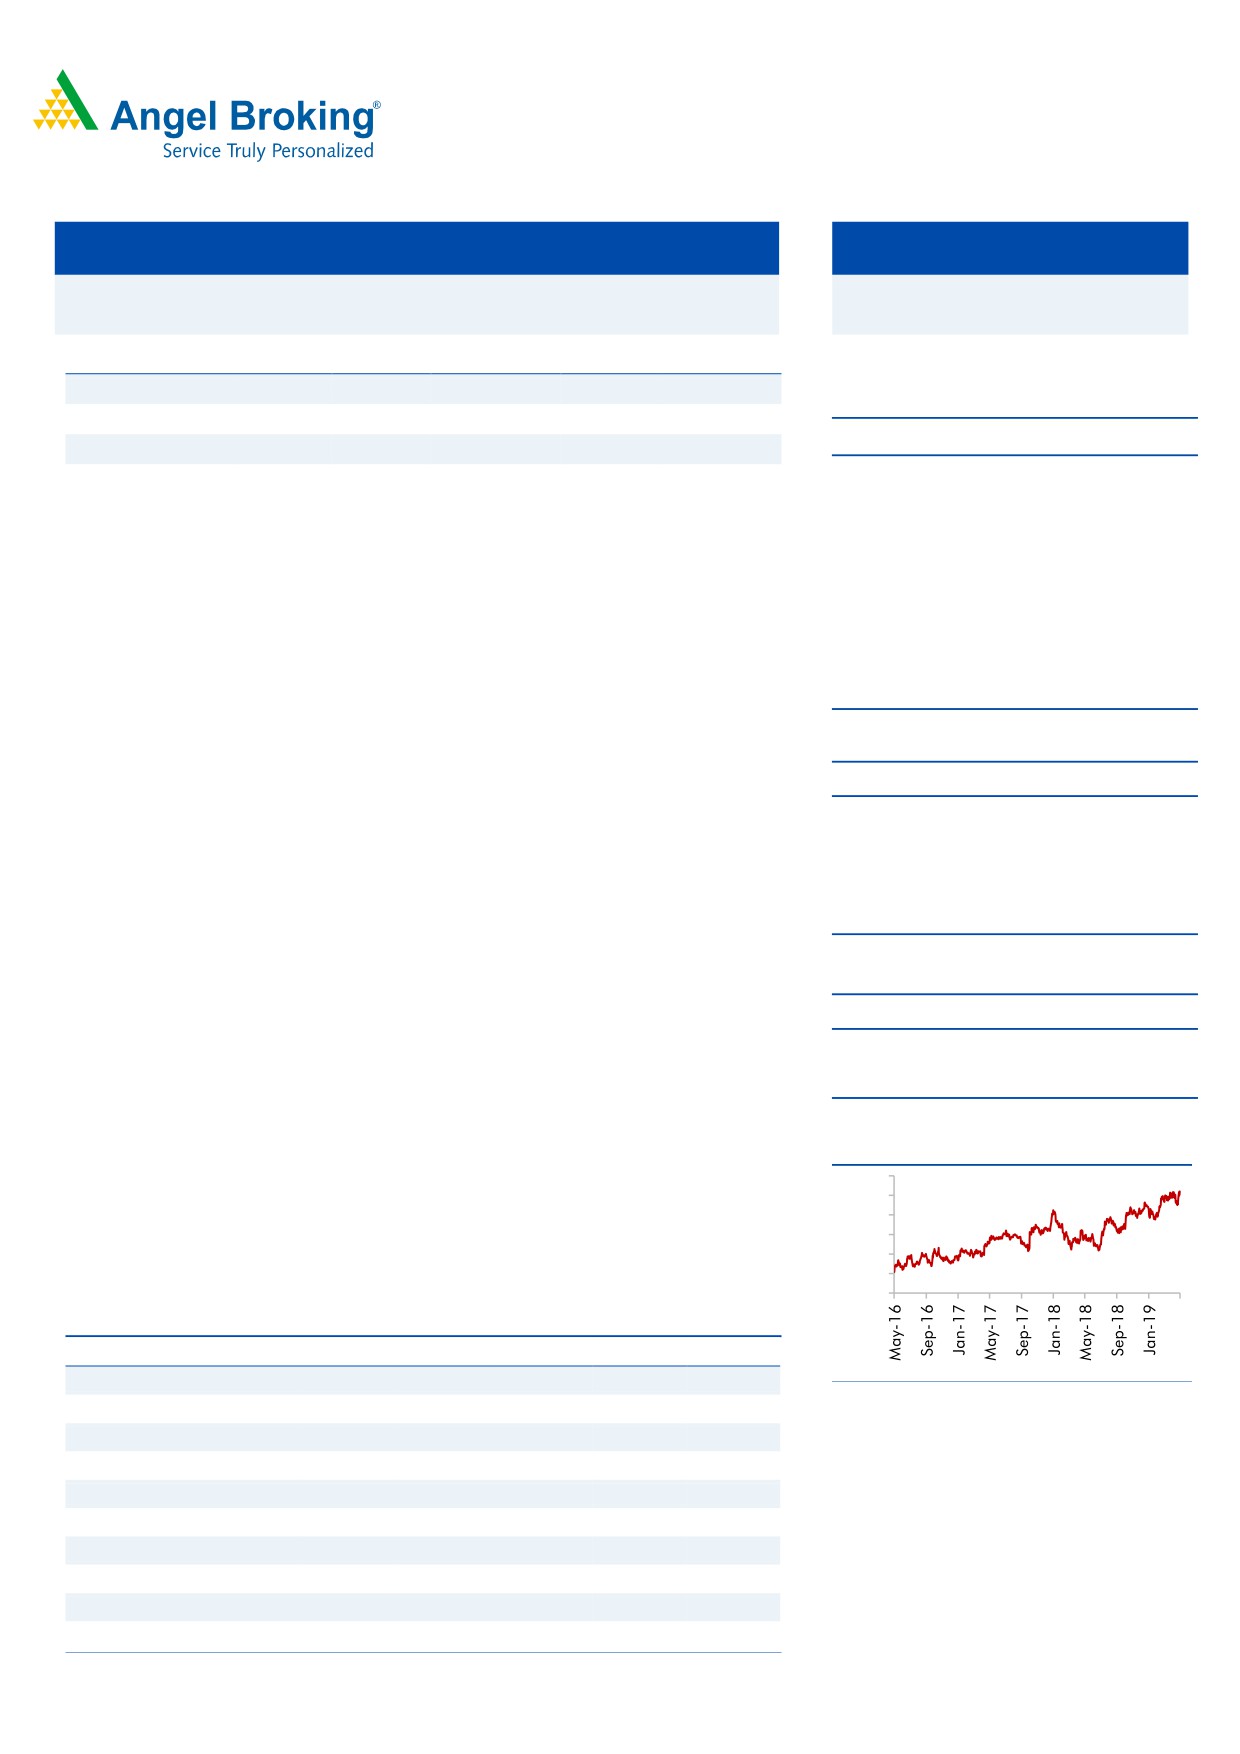
3-year price chart
retail assets & better rated companies, strong capitalization (tier I of
14.73%),
450
400
steady improvement in stressed loan and going forward quick resolution under
350
IBC would be the key triggers for expansion. We recommend a Buy on the stock
300
250
with a Target Price of `490.
200
150
Exhibit 1: Key Financials
Y/E March (` cr)
FY17
FY18
FY19
FY20E
FY21E
NII
21,738
23,025
27,015
31,749
37,524
Source: Company, Angel Research
% chg
2
6
17
18
18
Net profit
9,802
6,645
3,362
12,600
15,448
% chg
0.8
(32.2)
(49.4)
275
23
NIM (%)
3.2
3.1
3.2
3.4
3.5
EPS (`)
15
10
5
20
24
P/E (x)
28
42
83
22
18
Jaikishan Parmar
P/ABV (x)
4
3
3
3
2
Research Analyst
RoA (%)
1.3
0.8
0.4
1.2
1.3
022 - 39357600 Ext: 6810
RoE (%)
10
6
3
11
12
Source: Company
Please refer to important disclosures at the end of this report
1
ICICI Bank | 4QFY2019 Result Update
Exhibit 1: Quarterly Summary
Particular (` cr)
Q1FY18
Q2FY18
Q3FY18
Q4FY18
Q1FY19
Q2FY19
Q3FY19
Q4FY19
YOY
QoQ
Interest Income
13,459
13,577
13,665
14,264
14,722
15,106
16,280
17,293
21
6
Interest Expenses
7,869
7,868
7,960
8,243
8,620
8,688
9,405
9,673
17
3
Net Interest Income (NII)
5,590
5,709
5,705
6,022
6,102
6,418
6,875
7,620
27
11
Other Income
3,388
5,186
3,167
5,678
3,851
3,156
3,883
3,621
(36)
(7)
Fee Income
2,377
2,570
2,639
2,755
2,754
2,995
3,062
3,178
15
4
Total Income
16,847
18,763
16,832
19,942
18,573
18,262
20,163
20,914
5
4
Net Income
8,978
10,895
8,872
11,700
9,953
9,574
10,758
11,241
(4)
4
Operating Expenses
3,794
3,909
3,814
4,186
4,145
4,324
4,612
5,008
20
9
Employee Expenses
1,511
1,514
1,363
1,526
1,514
1,661
1,734
1,899
24
10
Other Operating Expenses
2,283
2,395
2,452
2,660
2,631
2,663
2,878
3,109
17
8
Cost / Income %
42%
36%
43%
36%
42%
45%
43%
45%
290
168
Operating Profit
5,184
6,986
5,057
7,513
5,808
5,250
6,146
6,233
(17)
1
Provisions
2,609
4,503
3,570
6,626
5,971
3,994
4,244
5,451
(18)
28
PBT
2,575
2,483
1,488
888
(164)
1,255
1,902
782
(12)
(59)
Provisions for Tax
526
425
(162)
(132)
(43)
347
297
(187)
42
(163)
Tax Rate %
20%
17%
-11%
12%
23%
23%
23%
23%
-
PAT
2,050
2,058
1,650
1,019
(120)
909
1,605
969
(5)
(40)
Source: Company, Angel Research, % changes are on bps
Exhibit 2: Advance Trend and Profitability
Particular (` cr)
Q1FY18
Q2FY18
Q3FY18
Q4FY18
Q1FY19
Q2FY19
Q3FY19
Q4FY19
YOY
QoQ
Advances
4,64,075
4,82,780
5,05,387
5,12,395
5,16,289
5,44,487
5,64,308
5,86,647
14.5
4
Deposits
4,86,254
4,98,643
5,17,403
5,60,975
5,46,878
5,58,669
6,06,755
6,52,920
16.4
8
Savings
1,69,950
1,78,480
1,85,851
2,00,967
1,99,604
2,07,476
2,10,793
2,27,671
13.3
8
Current
68,073
68,396
74,784
88,958
76,689
76,072
88,581
96,269
8.2
9
CASA
2,38,023
2,46,876
2,60,635
2,89,925
2,76,293
2,83,548
2,99,374
3,23,940
11.7
8
CASA%
48.95
49.51
50.37
51.68
50.52
50.75
49.34
49.61
(206.8)
27.4
SA%
71.40
72.30
71.31
69.32
72.24
73.17
70.41
70.28
96.5
(12.9)
CA%
28.60
27.70
28.69
30.68
27.76
26.83
29.59
29.72
(96.5)
12.9
Term
2,48,231
2,51,767
2,56,768
2,71,050
2,70,585
2,75,121
3,07,381
3,28,980
21.4
7
Borrowings
1,41,460
1,50,702
1,58,176
1,82,859
1,61,970
1,74,686
1,64,293
1,65,320
(9.6)
1
Profitability
Yield Advance
8.49
8.53
8.29
8.40
8.54
8.68
9.04
8.98
58
(5)
Cost of Fund
4.81
4.93
4.75
4.49
4.54
4.78
4.62
4.73
25
11
Spread
3.68
3.60
3.54
3.92
4.00
3.90
4.42
4.25
33
(17)
Calculated NIM
3.35
3.38
3.27
3.27
3.25
3.44
3.55
3.74
47
19
Reported NIM
3.27
3.27
3.14
3.24
3.19
3.33
3.22
3.47
23
25
Source: Company, Angel Research, % changes are on bps
May 25, 2019
2
ICICI Bank | 4QFY2019 Result Update
Exhibit 3: GNPA Movement
Particular (` cr)
Q1FY18 Q2FY18 Q3FY18 Q4FY18 Q1FY19 Q2FY19 Q3FY19 Q4FY19
YOY
QoQ
Opening gross NPA
42,552
43,148
44,489
46,039
54,063
53,465
54,489
51,627
12.1
(5)
Add: gross additions
4,976
4,674
4,380
15,737
4,036
3,117
2,091
3,547
(77.5)
70
slippages
1.07%
0.97%
0.87%
3.07%
0.78%
0.57%
0.37%
0.60%
(247)
23
Slippages Annulised
3.87%
3.47%
12.29%
3.13%
2.29%
1.48%
2.42%
(987)
94
Less: recoveries & upgrades
2,775
1,029
1,108
4,234
2,036
1,006
1,916
1,522
(64.1)
(21)
% of Adv recoveries & upgrades
0.60%
0.21%
0.22%
0.83%
0.39%
0.18%
0.34%
0.26%
(57)
(8)
Net additions
2,201
3,645
3,272
11,503
2,000
2,111
175
2,025
(82.4)
1,057
Less: write-offs & sale
1,605
2,304
1,722
3,479
2,598
1,087
3,037
7,324
110.5
141
% of Adv recoveries & upgrades
0.35%
0.48%
0.34%
0.68%
0.50%
0.20%
0.54%
1.25%
57
71
Closing gross NPAs
43,148
44,489
46,039
54,063
53,465
54,489
51,627
46,328
(14.3)
(10)
GNPA
8.0%
7.87%
7.82%
8.84%
8.81%
8.54%
7.75%
6.70%
(214)
(105)
Less - Provision
17,842
20,359
22,229
26,177
29,295
32,403
35,339
32,715
25.0
(7)
Net NPAs
25,306
24,130
23,810
27,886
24,170
22,086
16,288
13,613
(51.2)
(16)
NPA
4.86%
4.43%
4.20%
4.77%
4.19%
3.65%
2.58%
2.06%
(271)
(52)
PCR
41.35%
45.76%
48.28%
48.42%
54.79%
59.47%
68.45%
70.62%
2,220
217
Source: Company, Angel Research, % changes are on bps
Exhibit 4: Advance Mix (%)
Particular
Q1FY18
Q2FY18
Q3FY18
Q4FY18
Q1FY19
Q2FY19
Q3FY19
Q4FY19
YOY
QoQ
Retail
53
54
54
57
57.5
57.5
57.5
60.1
334
264
Corporate
27
27
27
26
25.4
25.4
25.4
23.9
(191)
(151)
International
15
15
14
13
12.5
12.5
12.5
10.7
(186)
(176)
SME
5
4
5
5
4.6
4.6
4.6
5.2
22
62
Total
100
100
100
100
100
100
100
100
(20)
(0)
Advance YoY Growth
Retail
18.6
18.9
22.4
21.0
20.0
20.5
21.6
21.2
20.2
(41.3)
Corporate
(12.1)
(6.4)
(2.8)
(2.3)
(0.1)
2.0
(1.6)
3.3
561.7
491.7
International
(25.0)
(21.2)
(14.6)
(13.6)
(9.7)
(4.0)
(5.1)
(2.4)
1,125.0
270.5
Domestic
(2.6)
4.4
4.6
4.3
5.4
5.3
0.1
6.0
172.3
588.8
SME
16.2
6.3
17.7
15.0
13.7
21.8
12.2
19.5
450.1
726.3
Advance
3.3
6.3
10.5
10.4
11.3
12.8
11.7
14.5
411.6
283.3
Source: Company, Angel Research, % changes are on bps
May 25, 2019
3
ICICI Bank | 4QFY2019 Result Update
Exhibit 5: SOTP Summary
Valuation
Value/share
Particular
%
Methodology
(`)
Value of ICICI standalone
100
2x FY21E ABV
384
Subsidiaries
ICICI Prudential Life
54.9
On Current M.Cap
44
General Insurance
56
On Current M.Cap
45
ICICI Pru AMC
51
5% of current AUM
14
Other (Home Fin, VC, Securities PD and
26
Overseas subsidiaries)
Total subsidiaries' value @ 20% discount
103
Fair value per share
487
Outlook & Valuation: At the current market price, the bank’s core banking
business (after adjusting the value of subsidiaries) is trading at 1.6x FY2021E
ABV. We believe strength of liability franchise (CASA - 50%), shift in loan mix
towards retail assets & better rated companies, strong capitalization (tier I of
14.73%), steady improvement in stressed loan and going forward quick
resolution under IBC would be the key triggers for expansion. We recommend
a Buy on the stock with a Target Price of `490.
May 25, 2019
4
ICICI Bank | 4QFY2019 Result Update
Income Statement
Y/E March (` cr)
FY17
FY18
FY19
FY20E
FY21E
Net Interest Income
21,738
23,025
27,015
31,749
37,524
- YoY Growth (%)
2
6
17
18
18
Other Income
19,503
17,419
14,511
15,861
18,752
- YoY Growth (%)
27
(11)
-17
9
18
Operating Income
41,241
40,444
41,526
47,610
56,275
- YoY Growth (%)
13
(2)
3
15
18
Operating Expenses
14,754
15,704
18,089
20,739
23,959
- YoY Growth (%)
16
6
15
15
16
Pre - Provision Profit
26,487
24,741
23,437
26,870
32,317
- YoY Growth (%)
11
(7)
-5
15
20
Prov. & Cont.
15,207
17,307
19,661
10,070
11,720
- YoY Growth (%)
30
14
14
(49)
16
Profit Before Tax
11,279
7,434
3,776
16,800
20,597
- YoY Growth (%)
(8)
(34)
-49
345
23
Prov. for Taxation
1,478
789
413
4,200
5,149
- as a % of PBT
13
11
11
25
25
PAT
9,802
6,645
3,362
12,600
15,448
- YoY Growth (%)
1
(32)
(49.4)
275
23
Balance Sheet
Y/E March (` cr)
FY17
FY18
FY19
FY20E
FY21E
Equity
1,171
1,292
1,294
1,295
1,295
Reserve & Surplus
98,780
1,03,868
1,07,074
1,17,154
1,29,512
Net worth
99,951
1,05,160
1,08,368
1,18,449
1,30,807
Deposits
4,90,039
5,60,975
6,52,920
7,49,240
8,59,771
- Growth (%)
16
14
16
15
15
Borrowings
1,47,556
1,82,859
1,65,320
1,88,611
2,20,648
Other Liab. & Prov.
34,245
30,195
37,851
44,620
69,769
Total Liabilities
7,71,791
8,79,189
9,64,459
11,00,921
12,80,995
Cash Balances
31,702
33,102
37,858
44,274
50,805
Bank Balances
44,011
51,067
42,438
33,882
38,881
Investments
1,61,507
2,02,994
2,07,733
2,41,287
2,79,437
Advances
4,64,232
5,12,395
5,86,647
6,76,443
7,91,342
- Growth (%)
7
10
14
15
17
Fixed Assets
7,805
7,904
7,931
11,491
13,186
Other Assets
62,535
71,727
81,852
93,545
1,07,345
Total Assets
7,71,791
8,79,189
9,64,459
11,00,921
12,80,995
May 25, 2019
5
ICICI Bank | 4QFY2019 Result Update
Exhibit 6: Key Ratio
Y/E March
FY17
FY18
FY19
FY20E
FY21E
Profitability ratios (%)
NIMs
3.2
3.1
3.2
3.4
3.5
Cost to Income Ratio
36
39
44
44
43
RoA
1.3
0.8
0.4
1.2
1.3
RoE
10
6
3
11
12
B/S ratios (%)
CASA Ratio
50
52
50
51
51
Credit/Deposit Ratio
0.95
0.91
0.90
0.90
0.92
Asset Quality (%)
Gross NPAs
7.9
8.8
6.7
5.1
3.7
Net NPAs
4.9
3.5
2.7
2.0
1.5
Slippages
7.5
6.4
2.5
2.0
1.5
Loan Loss Prov. /Avg. Assets
2.04
2.10
2.13
0.98
0.98
Provision Coverage
40
48
71
70
70
Per Share Data (`)
EPS
15
10
5
20
24
ABVPS (70% cover.)
119
129
153
169
188
DPS
2
2
1
4
5
Valuation Ratios
PER (x)
28
42
83
22
18
P/ABVPS (x)
3.6
3.3
2.8
2.6
2.3
Dividend Yield (%)
0.5
0.5
0.2
0.9
1.1
DuPont Analysis
NII
2.9
2.8
2.9
3.1
3.2
(-) Prov. Exp.
2.0
2.1
2.1
1.0
1.0
Adj. NII
0.9
0.7
0.8
2.1
2.2
Other Inc.
2.6
2.1
1.6
1.5
1.6
Op. Inc.
3.5
2.8
2.4
3.6
3.7
Opex
2.0
1.9
2.0
2.0
2.0
PBT
1.5
0.9
0.4
1.6
1.7
Taxes
0.2
0.1
0.0
0.4
0.4
RoA
1.3
0.8
0.4
1.2
1.3
Leverage
7.9
8.0
8.6
9.1
9.6
RoE
10.3
6.5
3.1
11.1
12.4
Source: Valuation done on Closing price of 24/5/2019
May 25, 2019
6
ICICI Bank | 4QFY2019 Result Update
Research Team Tel: 022 - 39357800
DISCLAIMER
Angel Broking Limited (hereinafter referred to as “Angel”) is a registered Member of National Stock Exchange of India Limited, Bombay
Stock Exchange Limited, Metropolitan Stock Exchange Limited, Multi Commodity Exchange of India Ltd and National Commodity &
Derivatives Exchange Ltd It is also registered as a Depository Participant with CDSL and Portfolio Manager and Investment Adviser with
SEBI. It also has registration with AMFI as a Mutual Fund Distributor. Angel Broking Limited is a registered entity with SEBI for Research
Analyst in terms of SEBI (Research Analyst) Regulations, 2014 vide registration number INH000000164. Angel or its associates has not
been debarred/ suspended by SEBI or any other regulatory authority for accessing /dealing in securities Market. Angel or its
associates/analyst has not received any compensation / managed or co-managed public offering of securities of the company covered
by Analyst during the past twelve months.
This document is solely for the personal information of the recipient, and must not be singularly used as the basis of any investment
decision. Nothing in this document should be construed as investment or financial advice. Each recipient of this document should
make such investigations as they deem necessary to arrive at an independent evaluation of an investment in the securities of the
companies referred to in this document (including the merits and risks involved), and should consult their own advisors to determine
the merits and risks of such an investment.
Reports based on technical and derivative analysis center on studying charts of a stock's price movement, outstanding positions and
trading volume, as opposed to focusing on a company's fundamentals and, as such, may not match with a report on a company's
fundamentals. Investors are advised to refer the Fundamental and Technical Research Reports available on our website to evaluate the
contrary view, if any
The information in this document has been printed on the basis of publicly available information, internal data and other reliable
sources believed to be true, but we do not represent that it is accurate or complete and it should not be relied on as such, as this
document is for general guidance only. Angel Broking Limited or any of its affiliates/ group companies shall not be in any way
responsible for any loss or damage that may arise to any person from any inadvertent error in the information contained in this report.
Angel Broking Limited has not independently verified all the information contained within this document. Accordingly, we cannot testify,
nor make any representation or warranty, express or implied, to the accuracy, contents or data contained within this document. While
Angel Broking Limited endeavors to update on a reasonable basis the information discussed in this material, there may be regulatory,
compliance, or other reasons that prevent us from doing so.
This document is being supplied to you solely for your information, and its contents, information or data may not be reproduced,
redistributed or passed on, directly or indirectly.
Neither Angel Broking Limited, nor its directors, employees or affiliates shall be liable for any loss or damage that may arise from or in
connection with the use of this information.
Disclosure of Interest Statement
ICICI Bank
1. Financial interest of research analyst or Angel or his Associate or his relative
No
2. Ownership of 1% or more of the stock by research analyst or Angel or associates or relatives
No
3. Served as an officer, director or employee of the company covered under Research
No
4. Broking relationship with company covered under Research
No
Ratings (Based on expected returns
Buy (> 15%)
Accumulate (5% to 15%)
Neutral (-5 to 5%)
May 25, 2019
7
over 12 months investment period):
Reduce (-5% to -15%)
Sell (< -15)